EXECUTIVE SUMMARY

The Vincentric Canadian Diesel Analysis provides consumers and the automotive industry with information regarding the cost of owning a diesel vehicle compared to its closest gasoline powered counterpart. This year, results demonstrated that 118 of the 428 diesels (28%) analyzed offered a lower total cost of ownership than their closest gasoline powered equivalent.
Vincentric analyzed 856 vehicles with a majority of the vehicles in the Truck (368 diesel) category. Vans (36 diesels), SUV/Crossovers (14 diesels), and Passenger Cars (10 diesels) were also compared against their gasoline equivalents. The results showed that buyers should be cautious when purchasing a diesel truck as only 60 of the 368 diesels (16%) were found to be cost effective. Buyers of diesel SUV/Crossovers (including luxury brands) or diesel vans can feel confident, with all 50 diesels analyzed found to be cost effective. Most passenger cars, including luxury brands, were also cost effective with 8 of the 10 diesels (80%) having lower ownership costs than their gasoline counterparts.
COST OF OWNERSHIP COMPARISON
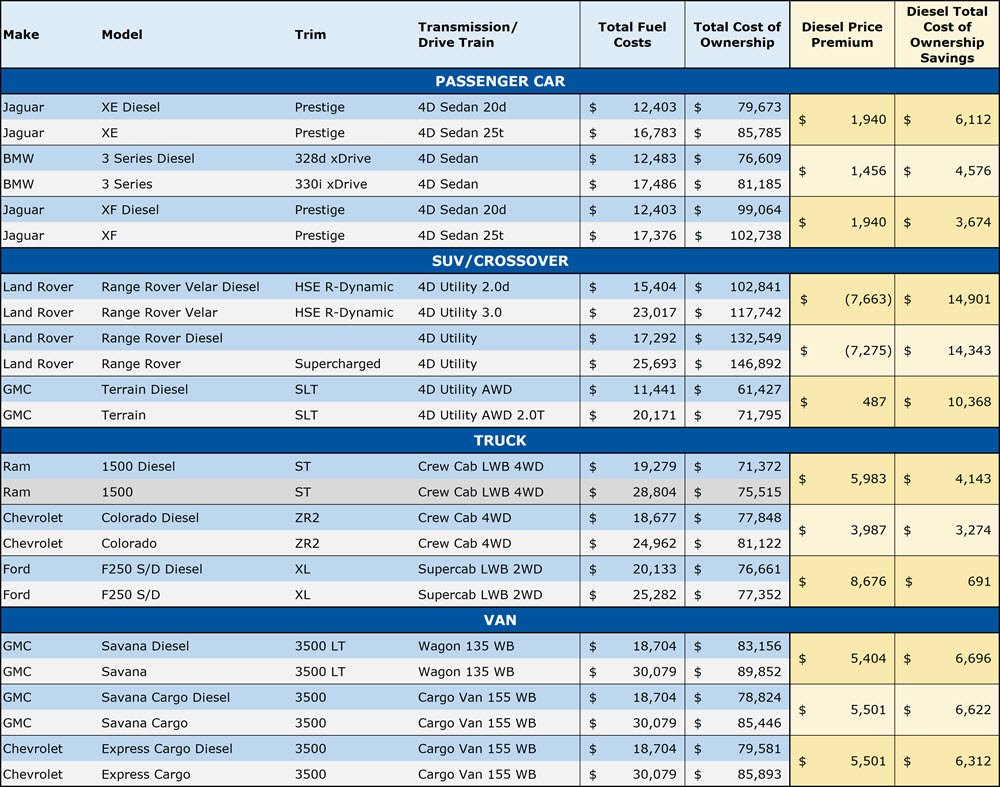
The Vincentric Canadian Diesel Analysis demonstrates that in addition to improved environmental benefits of diesels, a strong financial case can be made for the purchase of these 118 cost-effective diesels. The top three diesel vehicles from each category with the greatest cost of ownership savings compared to its closest gasoline powered equivalent are listed below:

Note: The top three diesel models are shown in blue and their gasoline powered counterparts are shown in gray. There may be vehicles of the same model but a different trim that are not included.
Although only 16% of diesel trucks were cost effective, truck buyers will have a better chance of finding cost-effective diesels looking at 1/2 ton and smaller pickups, with 26 of these 79 diesel trucks (33%) being cost effective. Heavy-duty (3/4 and 1 ton) pickups told a different story with only 34 of the 289 diesels (12%) being cost effective.
The primary reason that diesels have a higher total cost of ownership is their price premium. The market price of diesel trucks averaged $9,668 more than their gasoline powered counterparts while diesel vans cost an average of $5,625 more, diesel passenger cars cost an average of $2,486 more, and SUV/Crossovers cost an average of $1,122 less vs. a similar gasoline powered vehicle. These price premiums create higher costs for depreciation, taxes, and financing which are not always offset by diesel fuel cost savings.
Another factor causing diesel trucks to have the smallest percentage of cost-effective vehicles was their higher cost of maintenance. On average it costs $2,019 more for maintenance on diesel trucks compared to their gasoline counterparts. On the opposite end of the spectrum, diesel passenger cars showed maintenance costs that averaged $199 less than their gasoline powered counterparts over the five-year timeframe.
 Ultimately, it’s important for consumers to look at their needs and the specific models available because depending on the negotiated price, driving patterns, and intended length of ownership a diesel can still be a cost-effective purchase. Please contact customer.service@vincentric.com to discuss receiving the complete analysis results.
ABOUT THE CANADIAN DIESEL ANALYSIS
The Vincentric data team prepared the report to help users understand the financial dynamics, including cost of ownership and fuel savings of diesel vehicles compared to their closest gasoline powered counterparts. In addition to fuel costs, cost of ownership included seven other cost factors: depreciation, fees & taxes, financing, insurance, maintenance, opportunity cost, and repairs.
Fuel prices used in these reports are based on a weighted average over the previous five months, rather than the exact prices you might see at a gas station today. This is done to ensure that the analysis reflects current market trends and not market extremes.
The report assumes the vehicle is owned for five years with 25,000 kilometers driven annually. The numbers shown are Canadian averages, however, the same analysis can be done for any province plus the Northwest Territories.
|

If you are interested in learning more about other Industry Reports from Vincentric,
click here
|