How does Vincentric measure value? This question is best answered with an example. Two vehicles can have the same purchase price, but different ownership costs. The vehicle with the lower ownership costs is a better value than the one having the higher ownership costs.
To put this concept into action for the Best Certified Pre-Owned Value in America analysis, Vincentric first measured the cost of ownership for over 13,000 vehicle configurations. Cost of ownership is calculated by combining the costs associated with depreciation, insurance, repairs, maintenance (scheduled and unscheduled), finance, fuel, taxes and state fees (including the federal hybrid tax credit), and opportunity costs. This creates the “measured” cost of ownership.
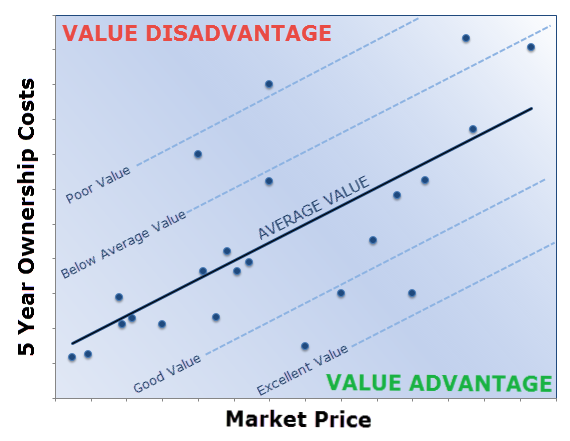
The vehicle's “expected” cost of ownership is based on statistical models that correlate the price of a vehicle with cost of ownership within each of the segments that comprise all vehicles. This correlation is represented graphically in the chart below by the line identified as "average value." Any vehicle that falls above the average value line is a better value than a vehicle that fall below the average value line.
Vincentric uses this approach to rate each vehicle from excellent to poor on a five point scale. These ratings can also be expressed numerically as 5, 4, 3, 2 or 1, with a score of 5 being excellent. The scores are calculated based on the percentage difference between a vehicle’s “expected” cost of ownership and its “measured” cost of ownership.
This statistically driven approach allows Vincentric to measure value in an unbiased manner, and help consumers and the automotive industry better understand how ownership costs impact the creation of value for the buyer.
< Back to Vincentric Best CPO Value in America Awards